Preliminary Analysis
Summary/Abstract
In this study we investigate trends in death rates from Acute Renal Failure (ICD-10 code N17) in the USA using crude data from the CDC (Centers for Disease Control and Prevention). We perform a detailed examination for individuals aged 35 to 44 for the period of 2000 to 2023 and then provide summary results for all age groups using the same analysis.
We compare trends Acute Renal Failure deaths where these appear on multiple causes (MC) of death, or as the underlying cause (UC). To remove the effect of Covid-19, we also analyse trends in death rates from Acute Renal Failure where Covid-19-related deaths are also reported in the death certificate.
It should be noted that this analysis is still at a preliminary stage and that a wider investigation is underway that will include the publication of a research paper. The importance of the preliminary results merit the current release of the preliminary analysis.
Trends in Death Rates from Acute Renal Failure (N17) for Ages 35-44
In this section we analyse the trend in yearly death rates from Acute Renal Failure for individuals aged 35 to 44 in the USA. We use the 2013-2019 trend in deaths per 100,000 (death rates) as the baseline estimate for excess death rates. Excess death rates for the 2013-2019 period are in-sample while the rates for 2020, 2021, 2022 and 2023 are out of sample computations.
Trends in Death Rates from Acute Renal Failure as Underlying Cause (UC) of Death
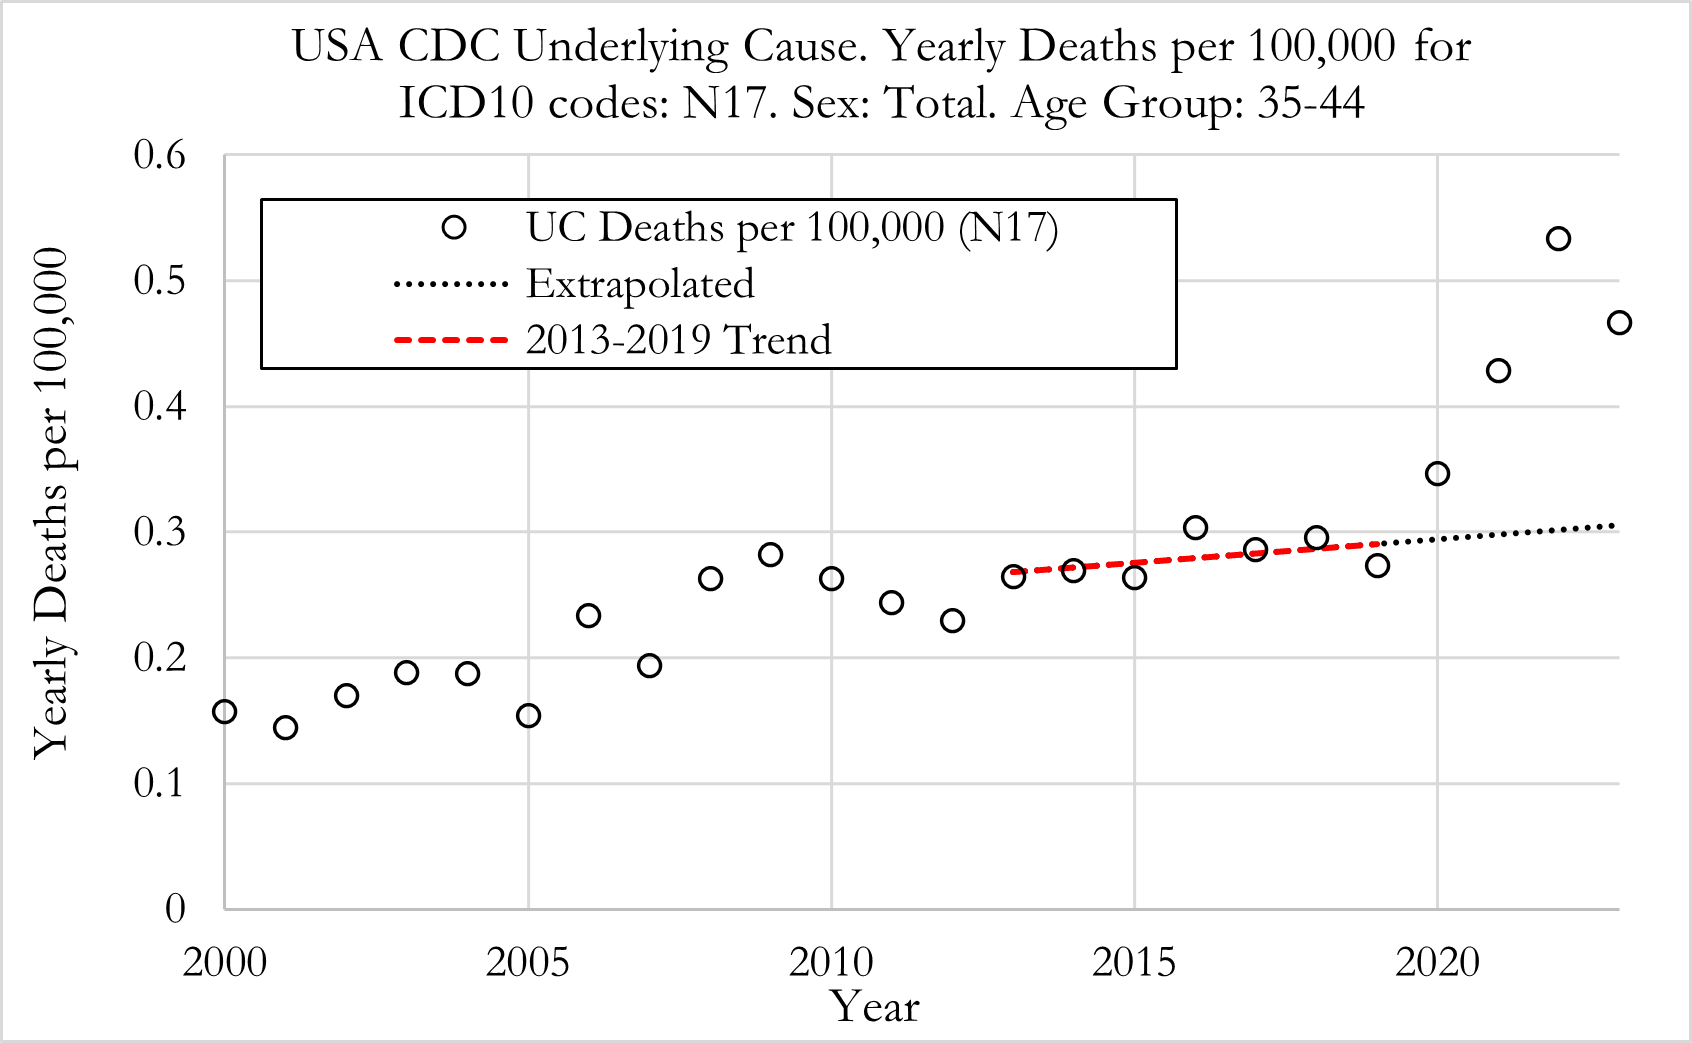
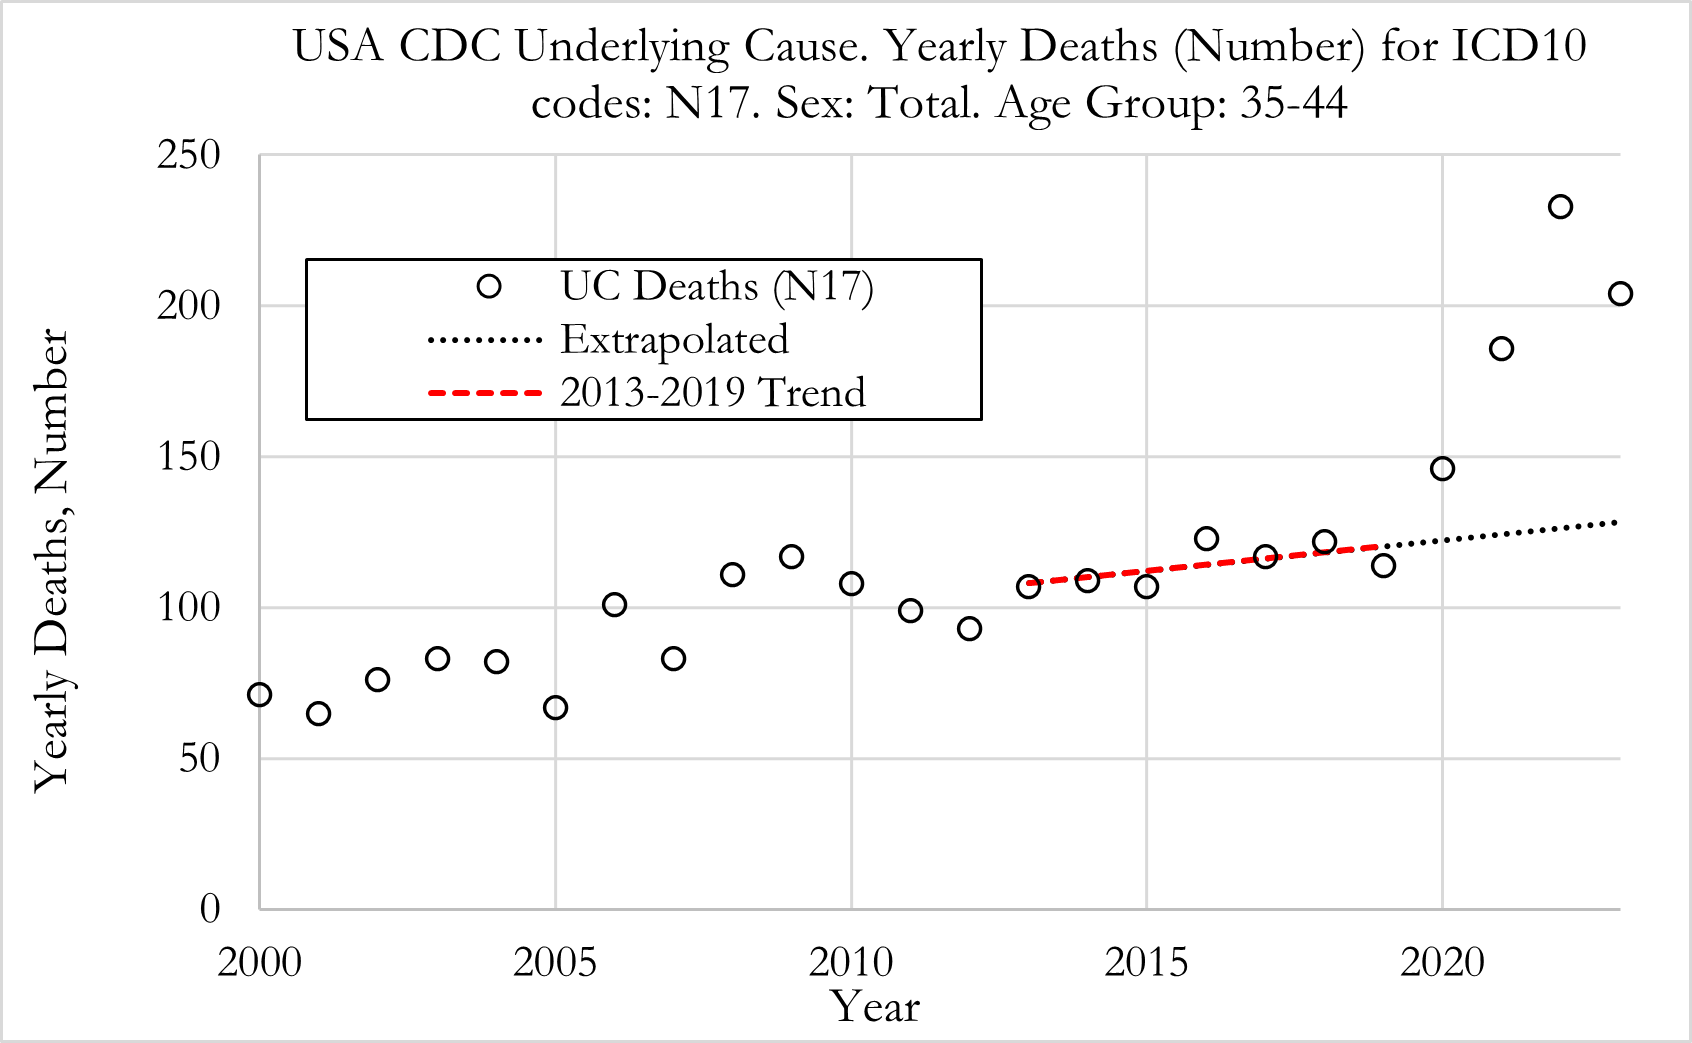
The Figure (left) below shows the death rate per 100,000 individuals for Acute Renal Failure deaths (ICD-10 code N17) as underlying cause in the US, for the 35-44 age group of both sexes. The Figure on the right shows the absolute number of deaths.
Trends in MC (Multiple-Cause) Death Rates from Acute Renal Failure
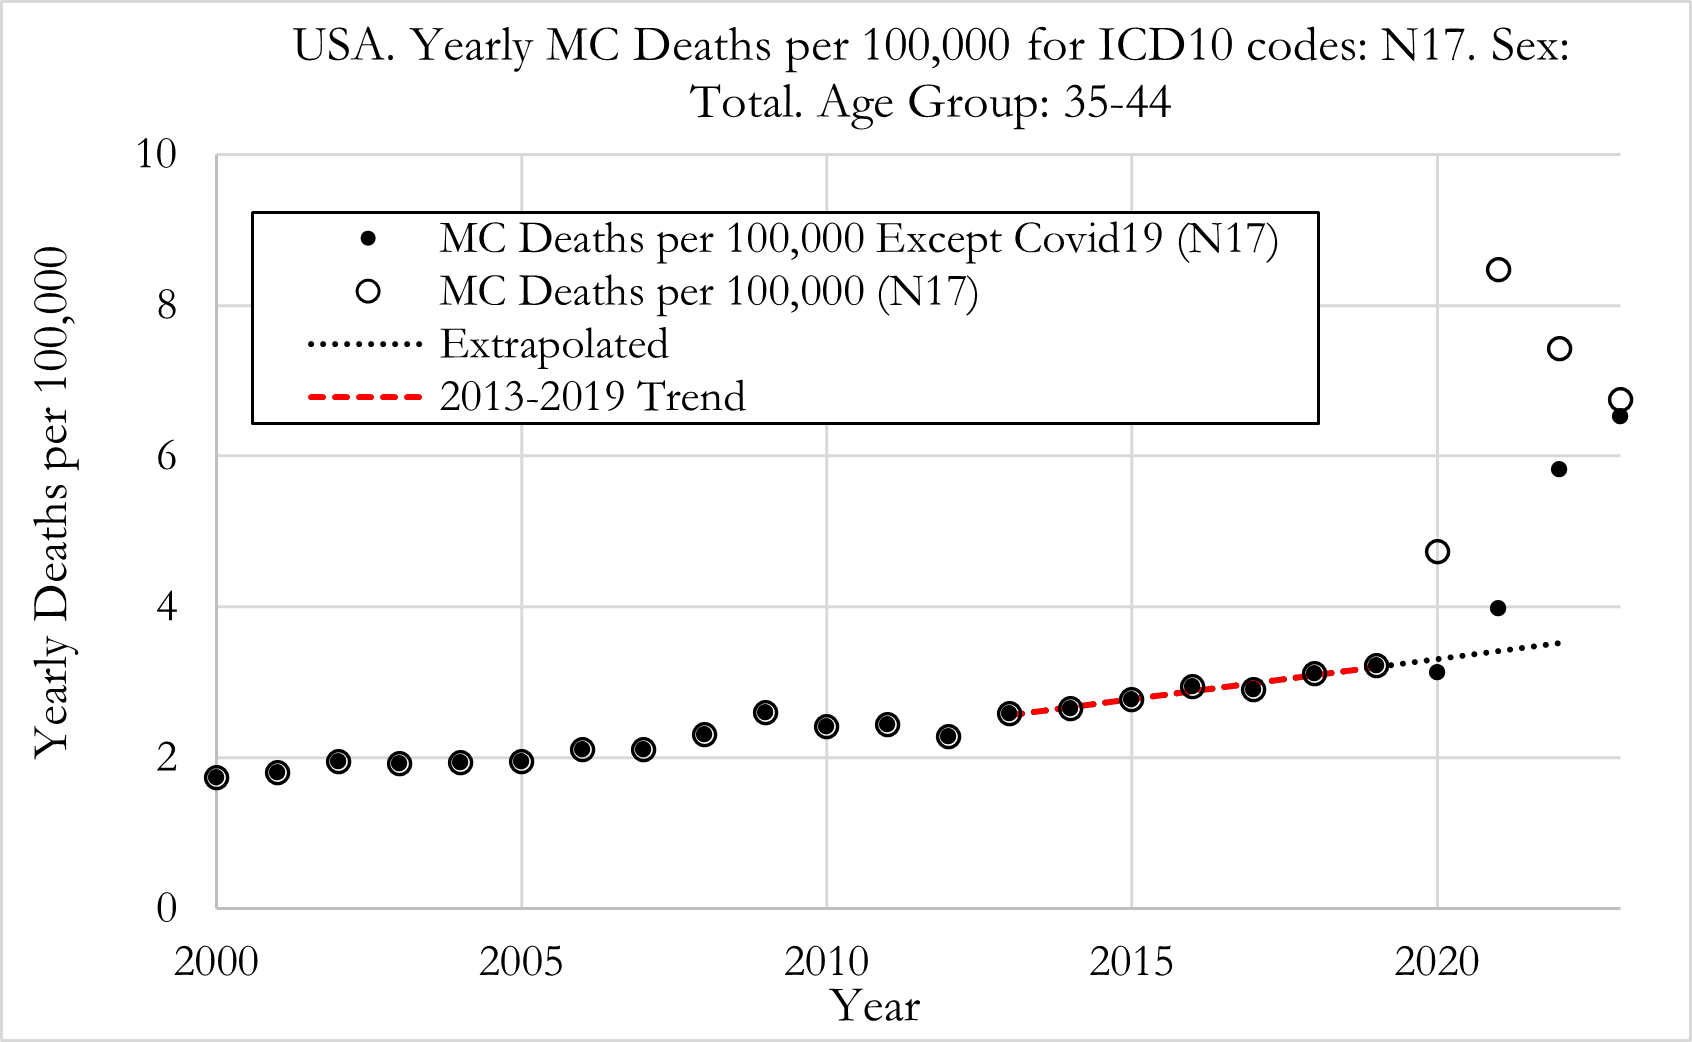
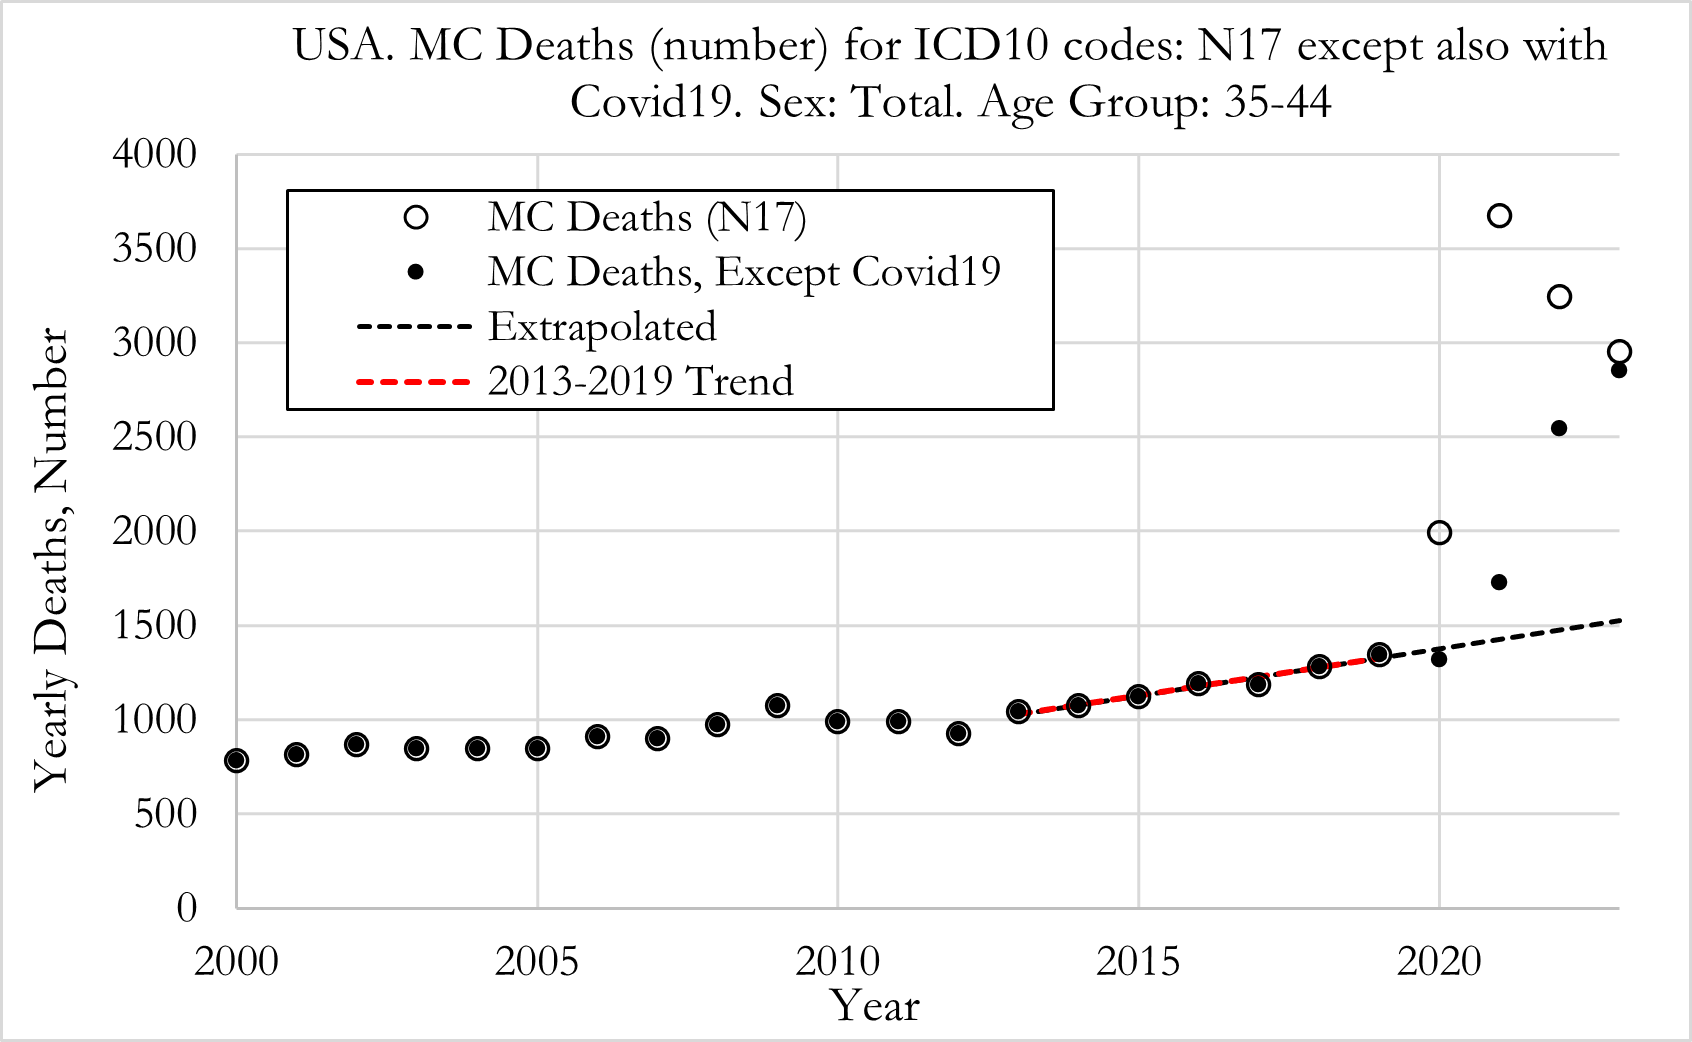
The Figure (left) below shows the death rate per 100,000 individuals for Acute Renal Failure deaths (ICD-10 code N17) recorded as multiple causes in the US, for the 35-44 age group of both sexes. The Figure on the right shows the absolute number of deaths.
Summary:
The results show a rise in death rates from Acute Renal Failure reported as underlying cause (UC) of death for individuals aged 35 to 44.
-
Death rates increased from around 0.29 per 100,000 in 2019 to 0.35 in 2020, 0.43 in 2021, 0.53 in 2022 and 0.48 in 2023.
-
In terms of estimated number of excess deaths from Acute Renal Failure for individuals aged 35-44, these were 23 in 2020, 56 in 2021, 98 in 2022 and 67 in 2023.
The results show a rise in death rates with Acute Renal Failure when reported as one of multiple causes that contributed to death, for individuals aged 35 to 44.
-
MC Death rates increased from around 3.2 per 100,000 in 2019 to 4.8 in 2020, 8.5 in 2021, 7.5 in 2022 and 6.8 in 2023.
-
MC* Death rates (Except Covid-19 related deaths) changed from around 3.2 per 100,000 in 2019 to 3.1 in 2020, 4.0 in 2021, 5.9 in 2022 and 6.7 in 2023.
-
MC and MC* death rates from Acute Renal Failure more than doubled from 2019 to 2023, for individuals aged 35-44 in the US.
-
In terms of estimated number of excess MC* deaths with Acute Renal Failure for individuals aged 35-44, these were -65 in 2020, 257 in 2021, 990 in 2022 and 1225 in 2023.
Excess Death Rates from Acute Renal Failure for Ages 35-44, Both Sexes.
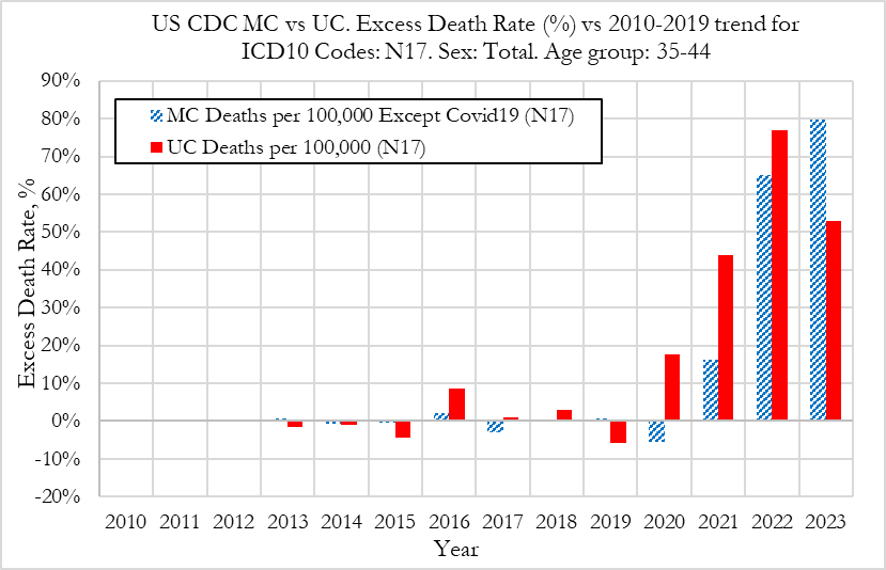
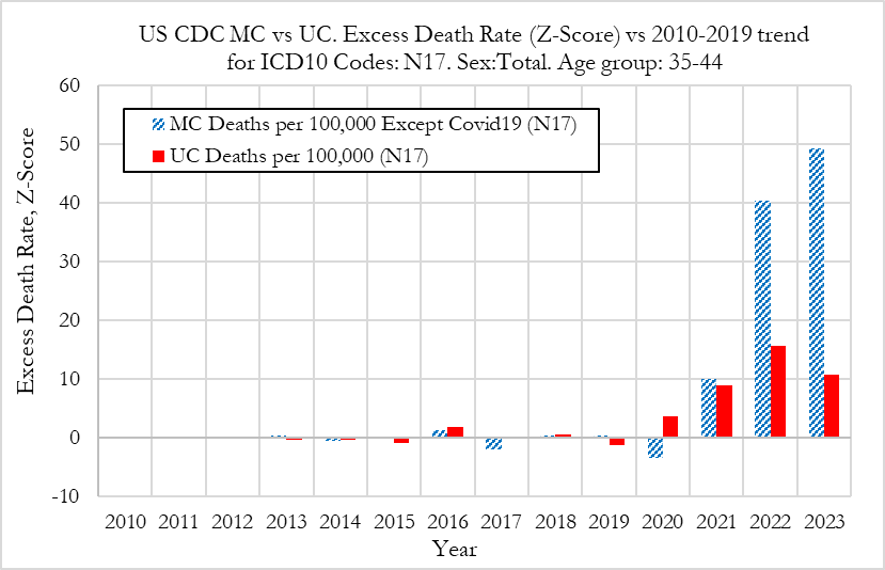
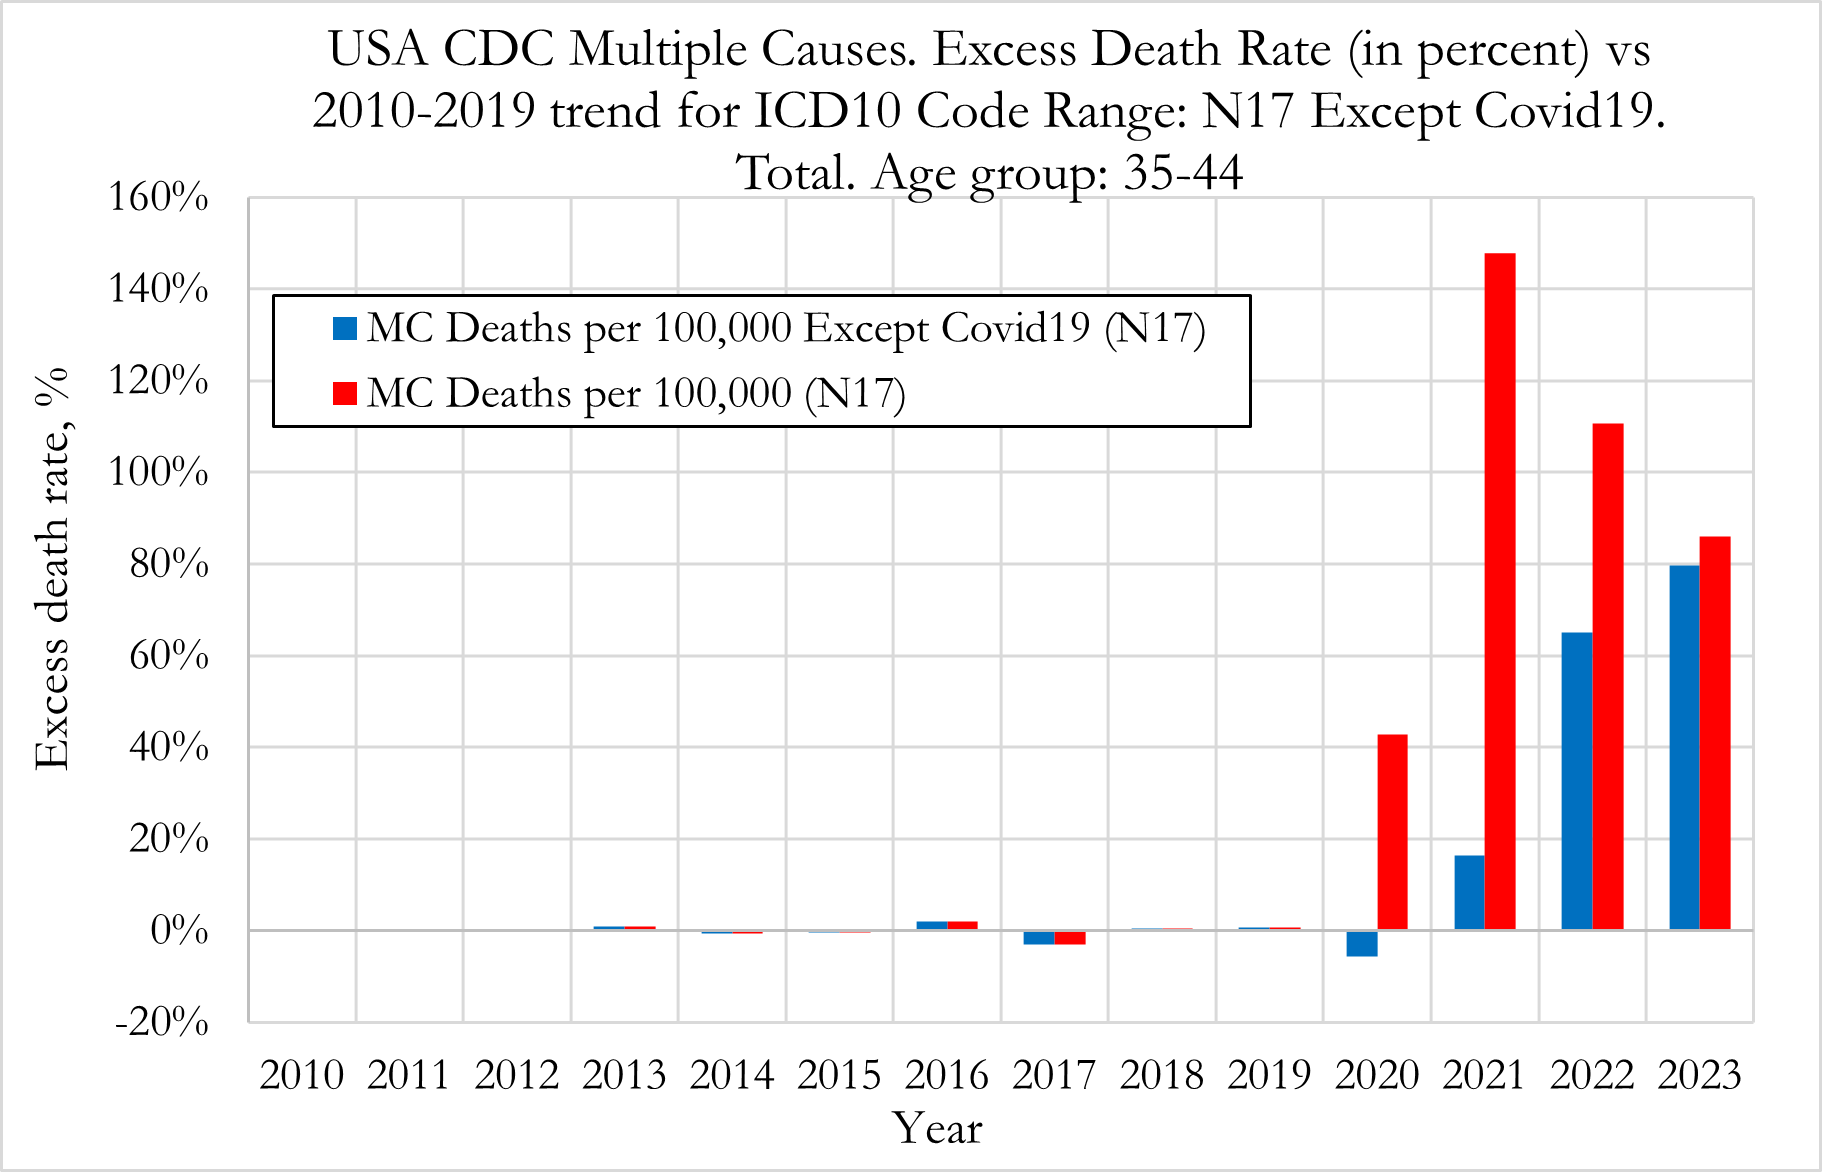
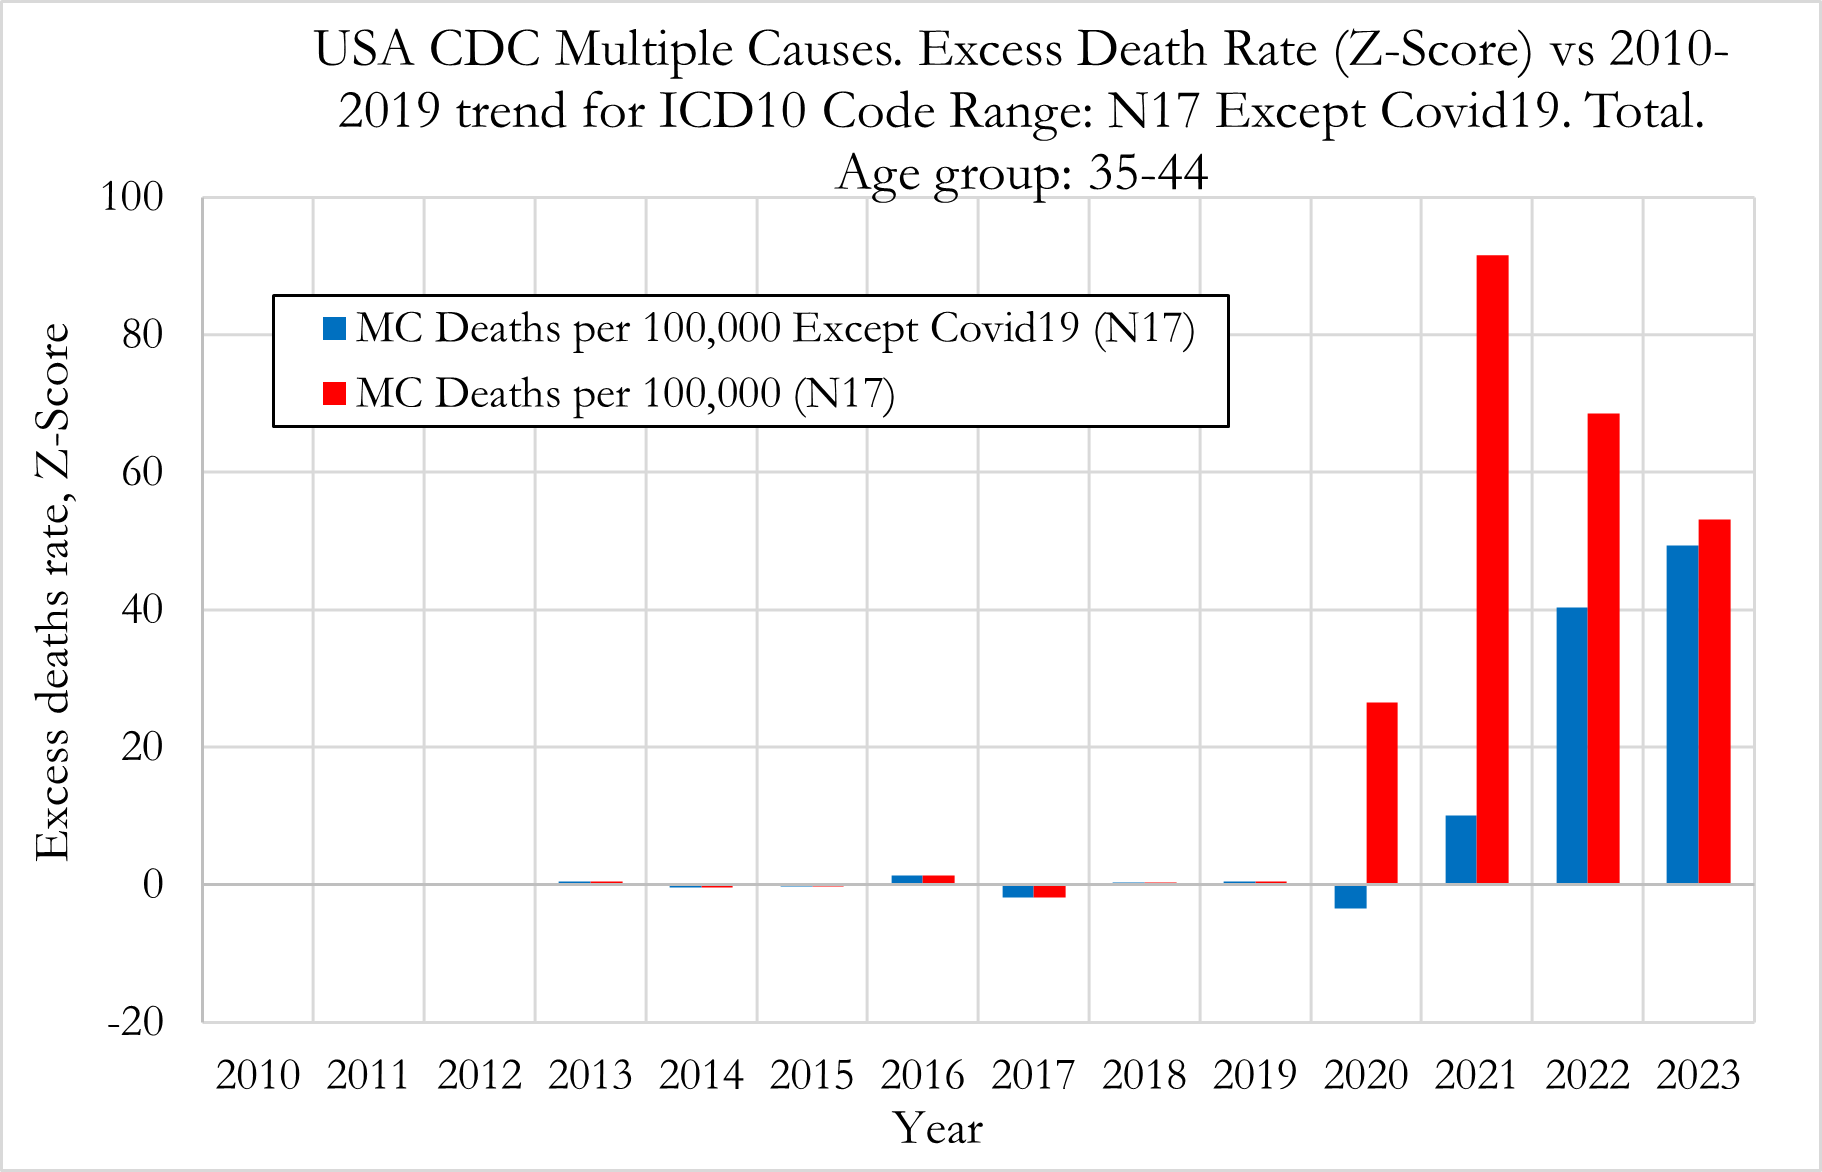
In this section we investigate excess death rates from Acute Renal Failure in the US, for the 35 to 44 age group from 2010 to 2023. The figure on the left refers to relative deviations from the 2010-2019 trend, while the figure on the right shows the Z-score (signal strength) for the deviations from trend.
Excess UC Death Rates from Acute Renal Failure, 35-44
The results show significant rises in excess UC and MC* death rates from/with Acute Renal Failure in 2021 to 2023, for individuals aged 35 to 44 in the US.
Summary:
-
Excess UC Death rates increased were +17.8% in 2020, +43.8% in 2021, +76.8% in 2022 and +52.9% in 2023. The increases were highly statistically significant in 2021, 2022 and 2023 with Z-Scores close-to or above 10. In 2020 the Z-Score was 2.8 indicating some statistical significance.
-
Excess MC* Death rates (Except Covid-19 related deaths) were -4.6% in 2020, +17.8% in 2021, +67.5% in 2022 and +82.6% in 2023. The increases were highly statistically significant in 2021, 2022 and 2023 with Z-Scores close-to or above 10. In 2020 the change was not statistically significant.
-
The larger statistical significance from excess MC* death rates compared to UC death rates were due to the larger sample size because the ratio of MC* to UC deaths are typically around 14x for the 35-44 age group.
Excess MC Death Rates from Acute Renal Failure, ages 35-44
The results show significant rises in excess MC and MC* death rates with Acute Renal Failure in 2021 to 2023, for individuals aged 35 to 44 in the US.
Summary:
-
Excess MC Death rates increased were +44.3% in 2020, +150.9% in 2021, +113.8% in 2022 and +89.0% in 2023. The increases were highly statistically significant in 2020, 2021, 2022 and 2023 with Z-Scores close-to or above 25.
-
Excess MC* Death rates (Except Covid-19 related deaths) were -4.6% in 2020, +17.8% in 2021, +67.5% in 2022 and +82.6% in 2023. The increases were highly statistically significant in 2021, 2022 and 2023 with Z-Scores close-to or above 10. In 2020 the change was not statistically significant.
-
Of note is that Excess MC* death rates with Acute Renal Failure increased progressively from 2020 through 2023.
Excess Death Rates from Acute Renal Failure for All age groups
In this section we investigate excess death rates from/with Acute Renal Failure in the US, for all 10y age groups.
Excess Death Rates from Acute Renal Failure for all ages, both sexes
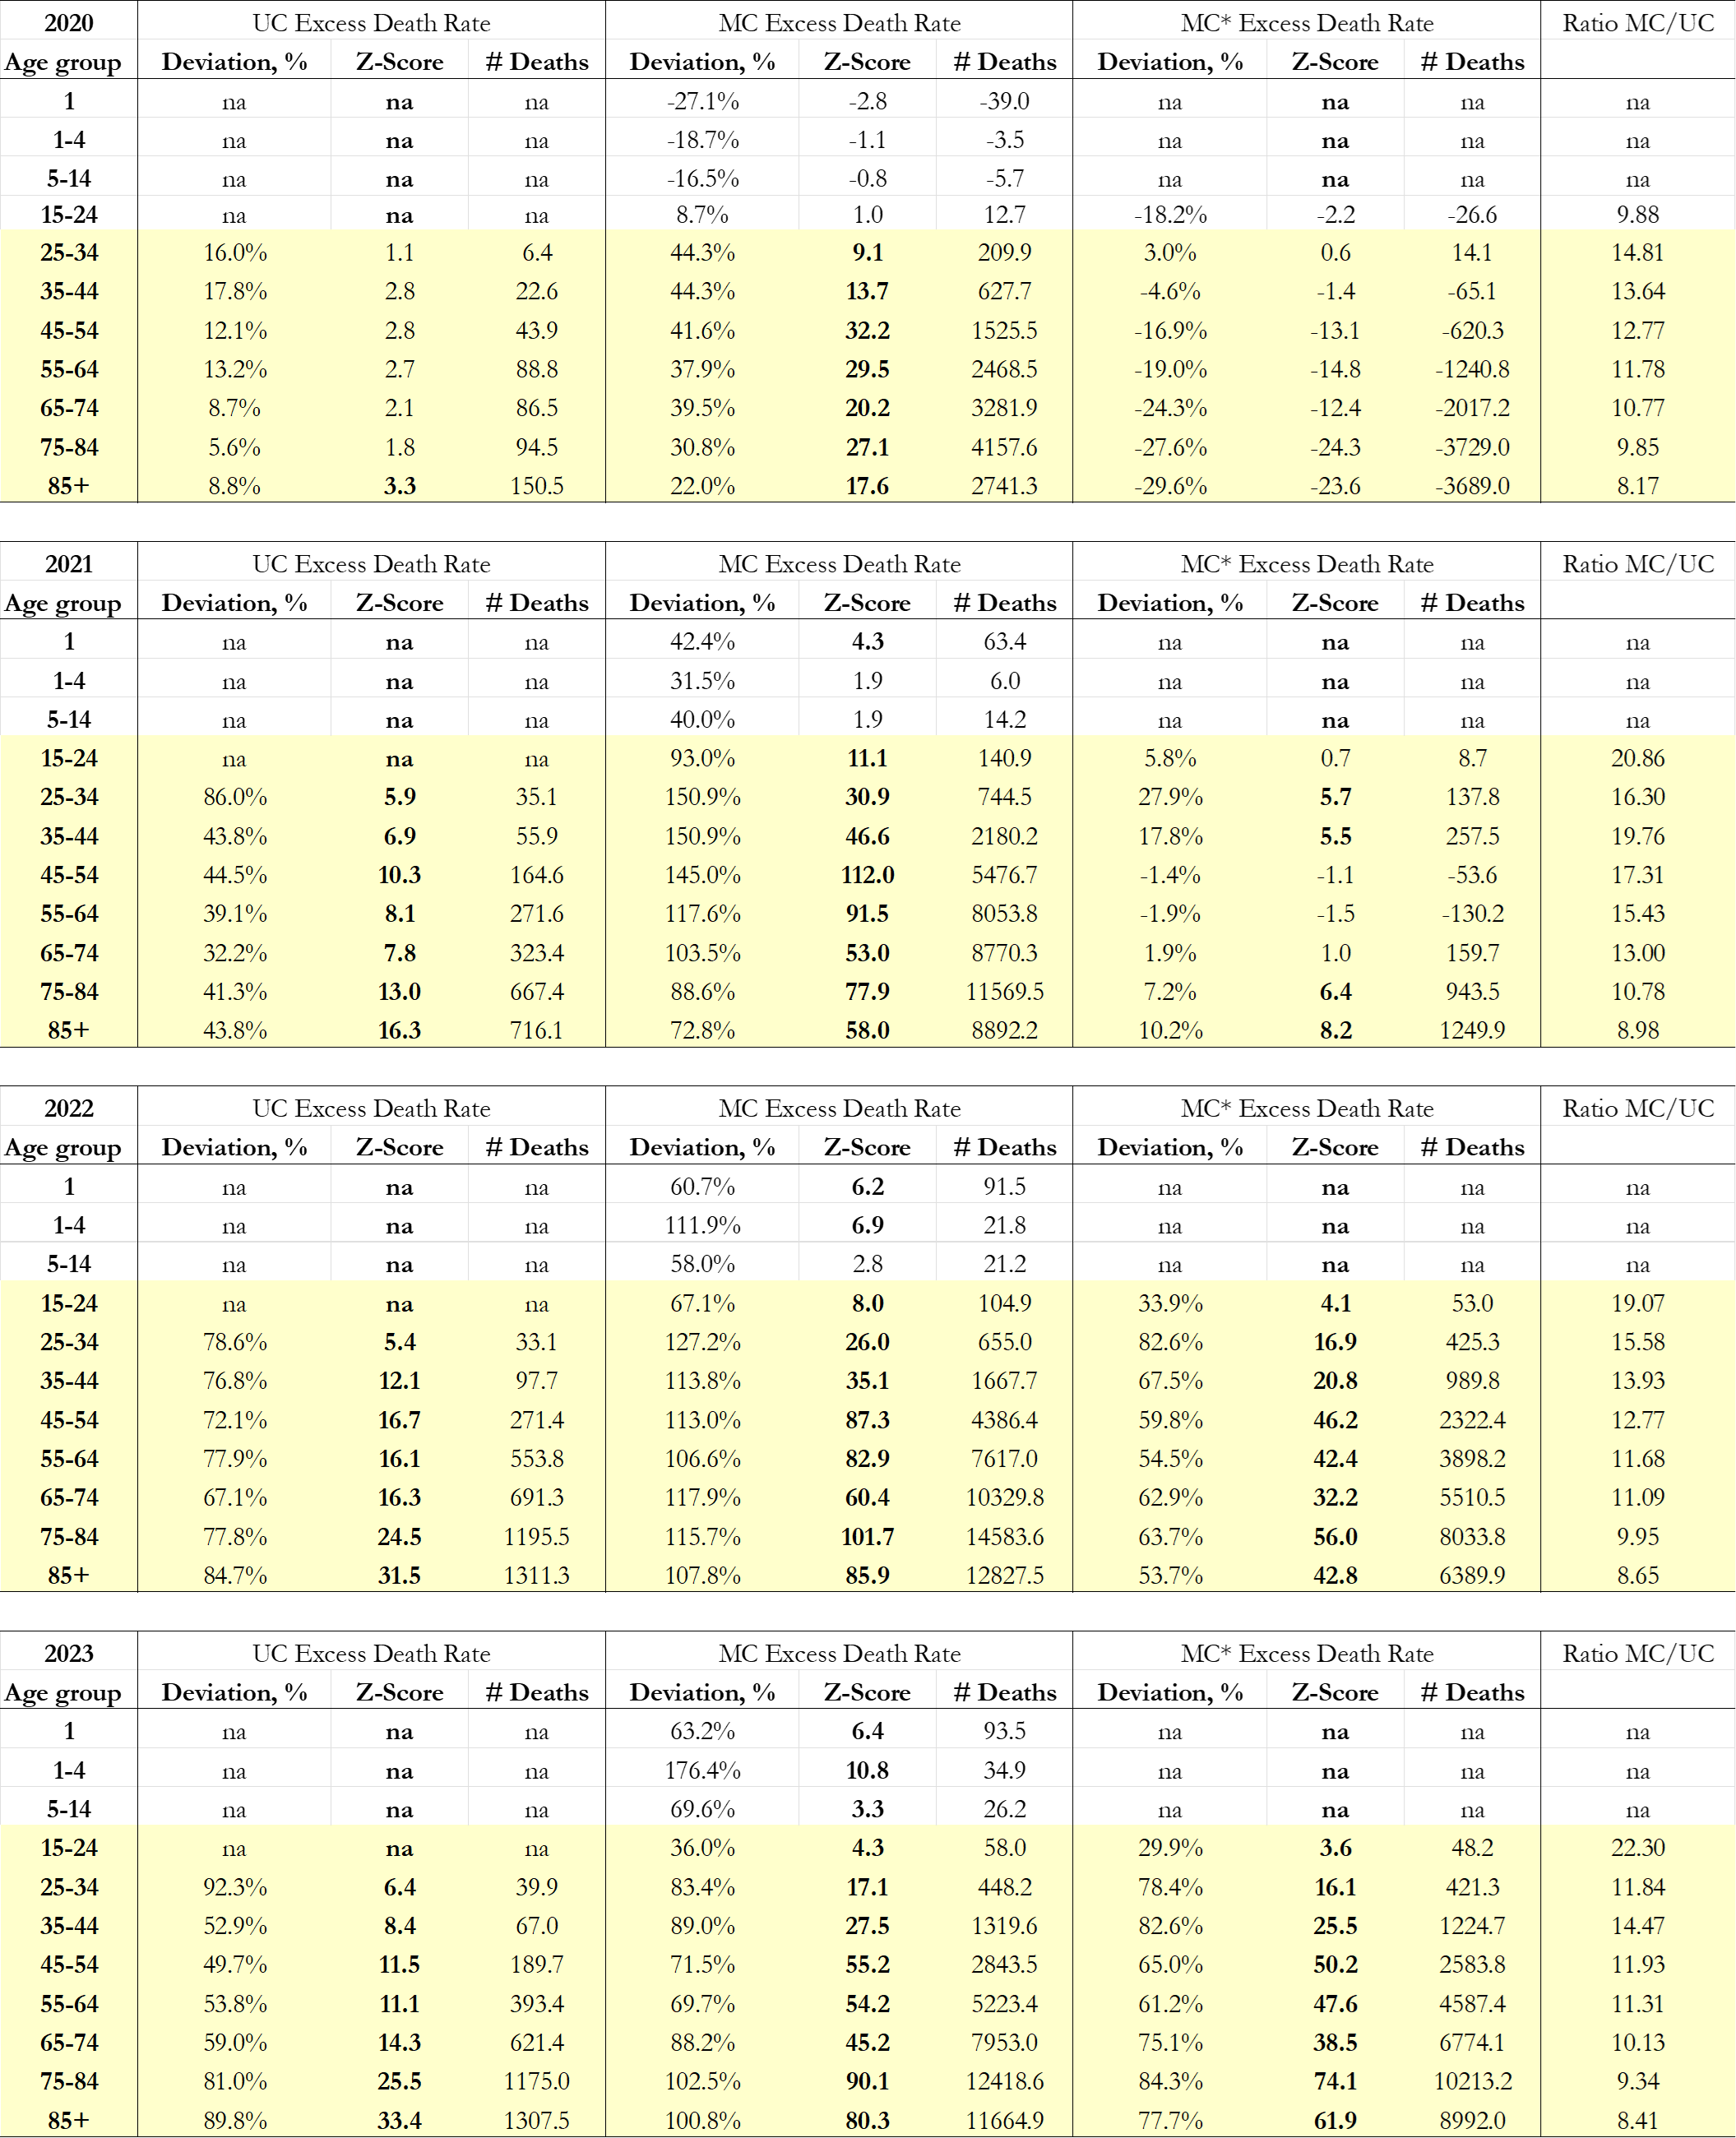
The excess death rates refer to deviations from the 2013-2019 trend. We show the excess deaths and death rates for MC, MC* (Except Covid-19) and UC deaths from Acute Renal Failure. The tables show relative deviations from the 2013-2019 trend, the respective Z-scores (signal strength) and estimated absolute number of excess deaths.
The results for age groups 1, 1-4, 5-14 and 15-24 are not reliable due to small sample sizes and suppressed data from the CDC.
Conclusions
-
The table below summarises the estimated total number of excess deaths from/with Acute Renal Failure, for individuals aged 25 and above in the US.

-
Of note is that Excess MC* death rates with Acute Renal Failure increased progressively from 2020 through 2023.
-
Even though Excess UC deaths from Acute Renal Failure were relatively low, this is due to the fact the Acute Renal Failure is usually not the underlying cause of death but a contributing factor which is illustrated by the much larger numbers of MC Acute Renal Failure deaths.
-
The results do not allow us to establish if the excess death rates in 2020 were due to the Covid-19 disease, the hospital protocols or other factors.
-
From 2021 to 2023 the excess deaths could have had a contribution form the Covid-19 disease, or the hospital protocols, but also the introduction of the Covid-19 vaccines.
Further work:
-
This is a preliminary data analysis and we are currently in the process of pursuing further investigations into this issue in more detail.
